Neptune-widths/2
Violin Plot
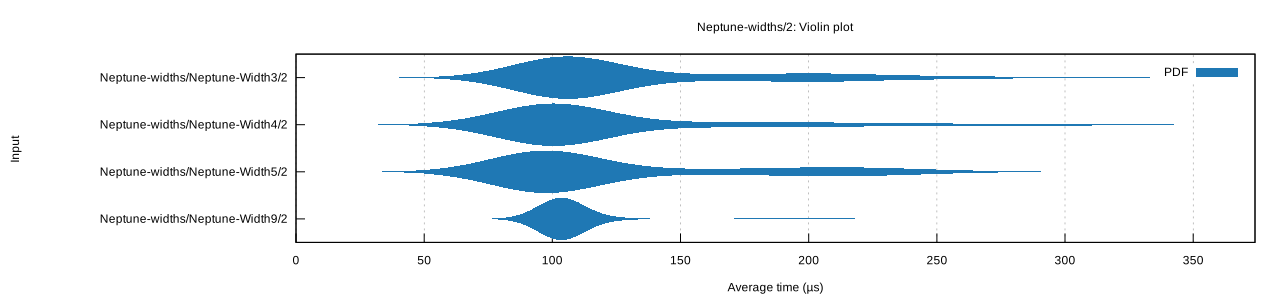
This chart shows the relationship between function/parameter and iteration time. The thickness of the shaded region indicates the probability that a measurement of the given function/parameter would take a particular length of time.
Neptune-widths/Neptune-Width3/2
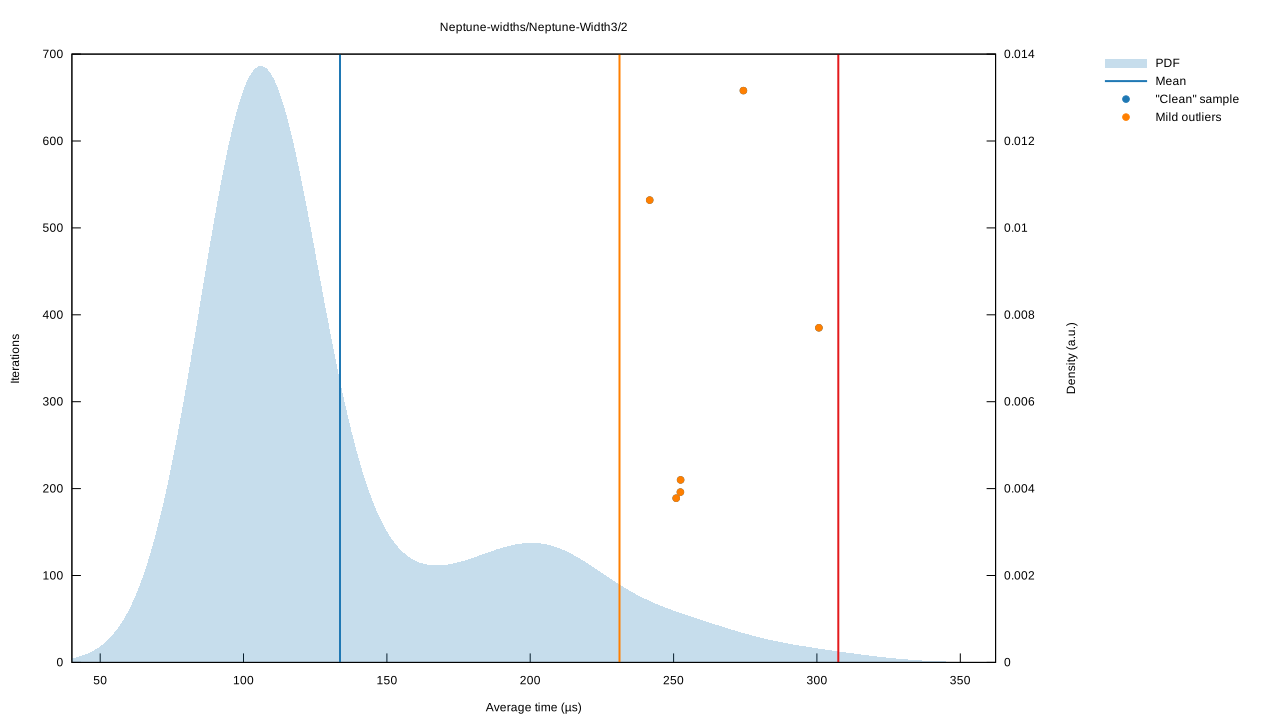
|
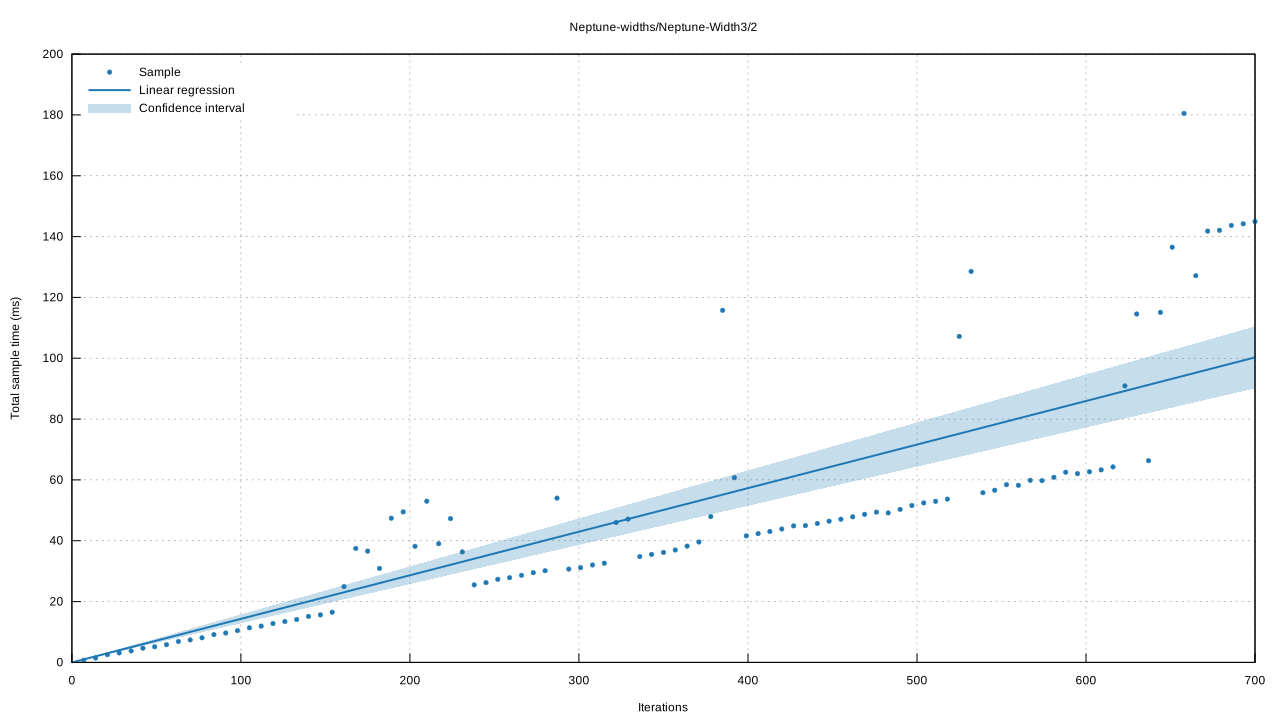
|
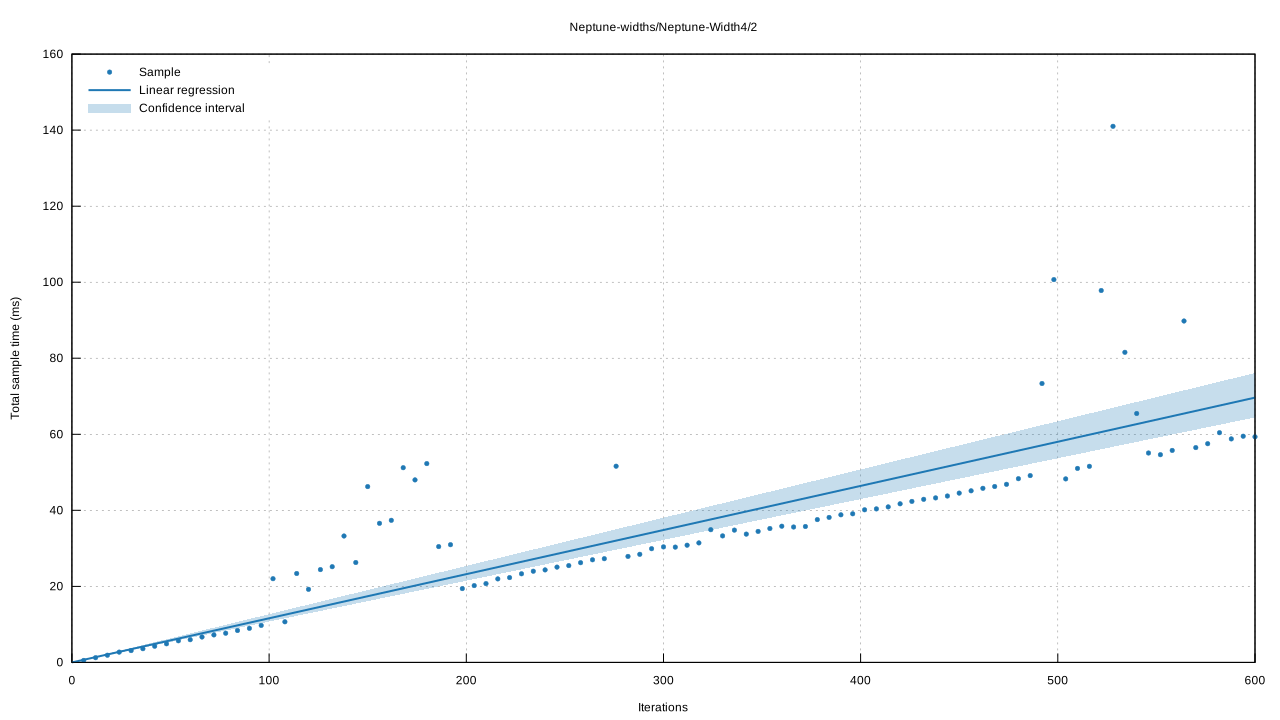
Neptune-widths/Neptune-Width4/2
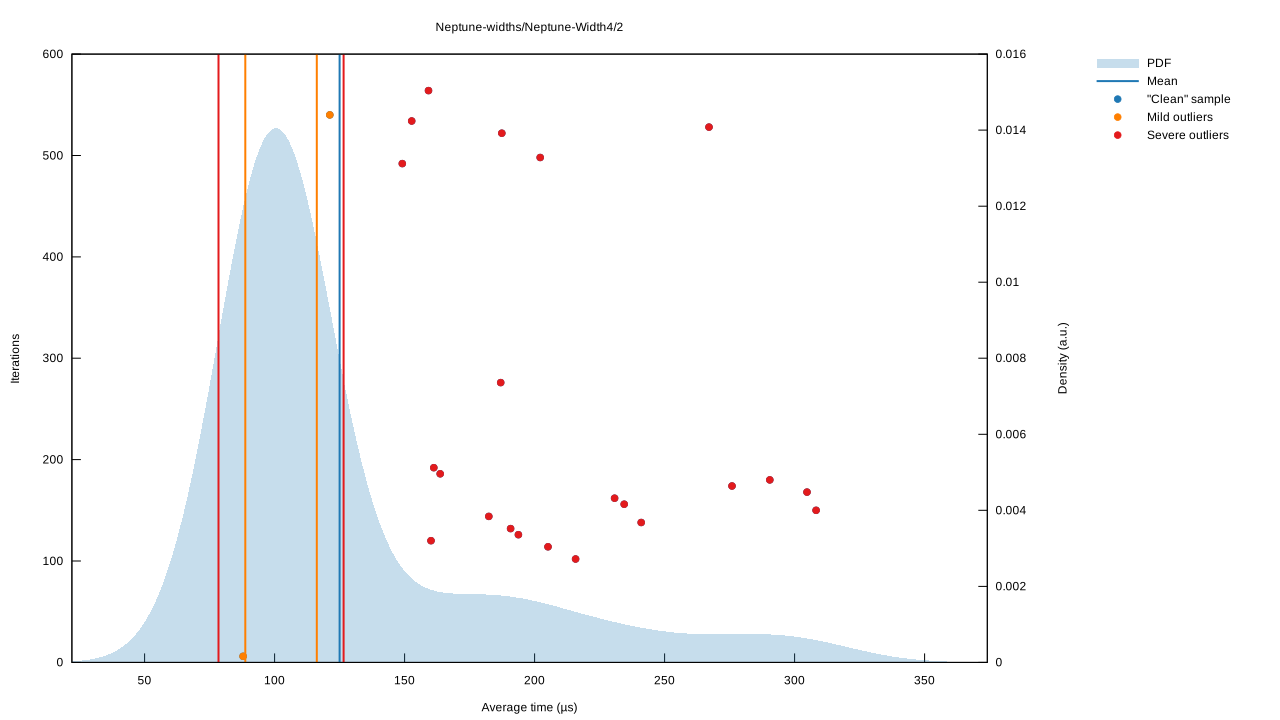
|
|
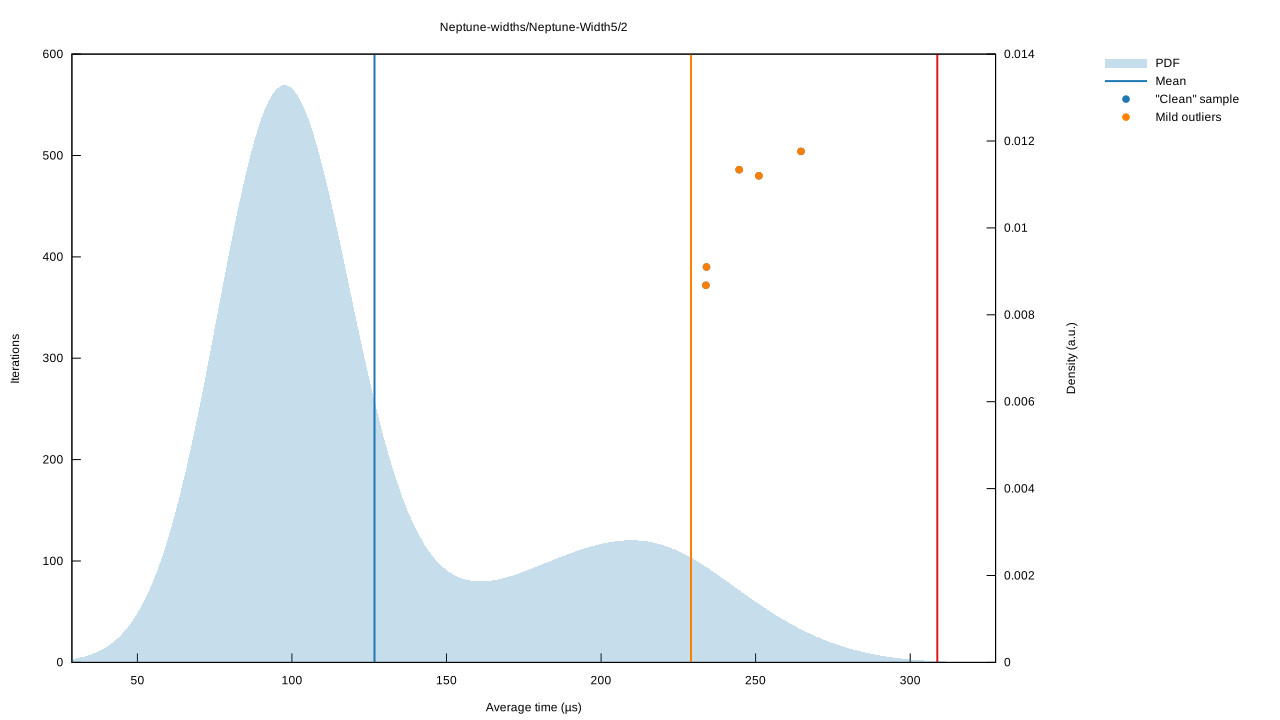
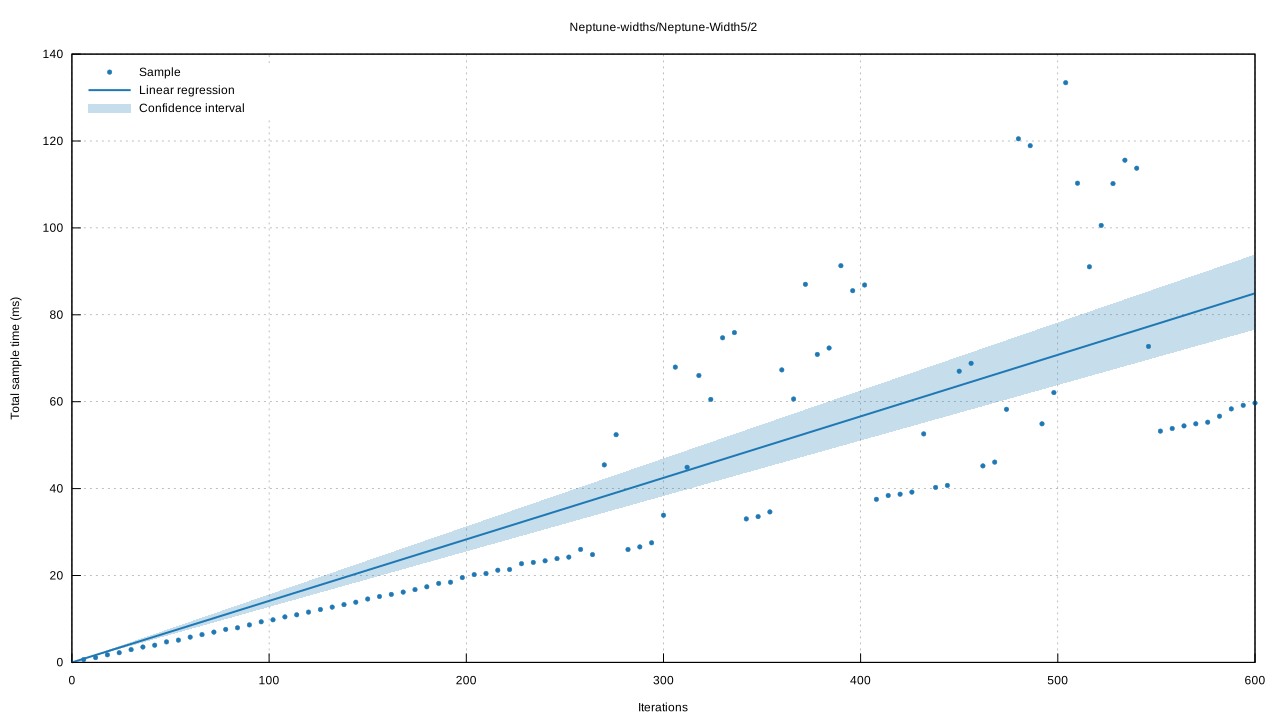
Neptune-widths/Neptune-Width5/2
|
|
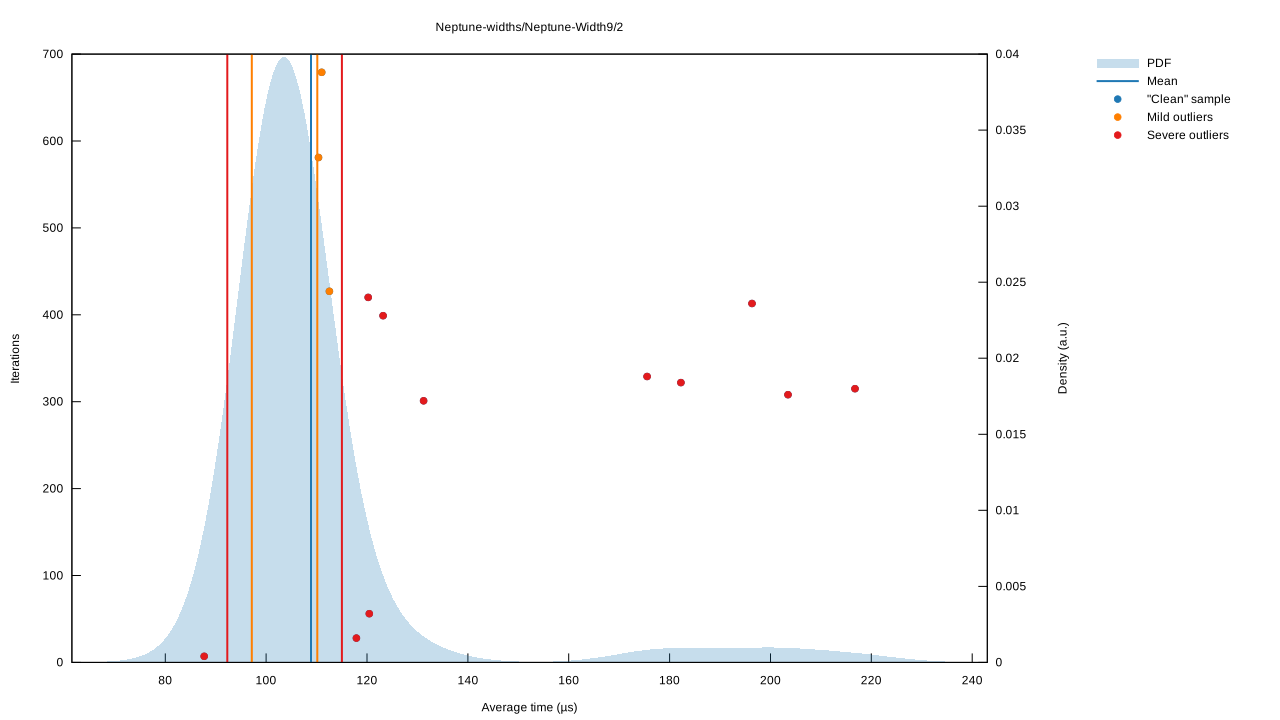
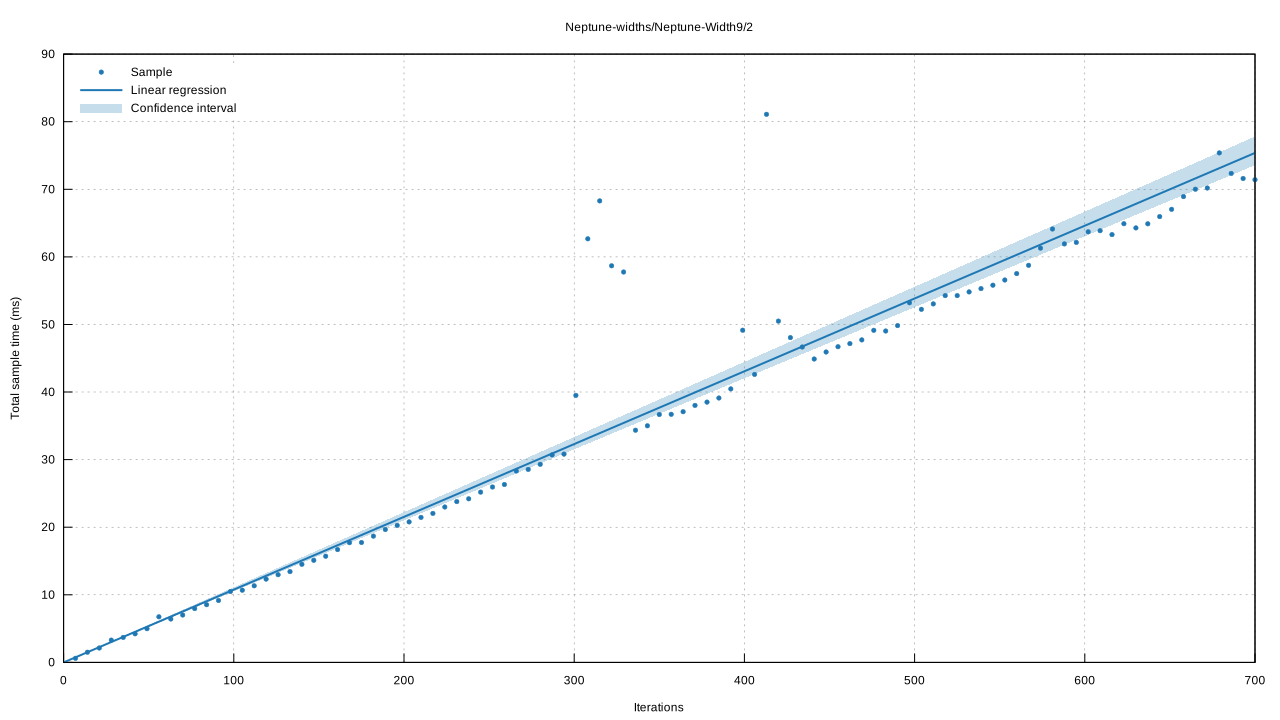
Neptune-widths/Neptune-Width9/2
|
|